Checkpoint
Complete the Checkpoint in your printout.
Watch topic videos, fill in guided notes and examples, and complete Checkpoints.
Refer to your print out for this lesson section and video. Complete the guided notes section as you watch the video.
Refer to your print out or open your Student Worktext to each example. Follow along and complete the examples as you watch the videos.
Plan
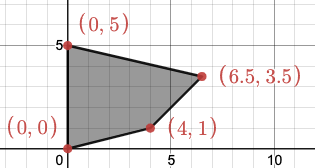
Label the vertices.
Substitute vertices into objective function and evaluate.
Determine minimum and maximum values.
Implement
𝑓(0, 0) = 3(0) – (0)
𝑓(0, 0) = 0
𝑓(0, 5) = 3(0) – (5)
𝑓(0, 5) = −5 minimum
𝑓(6.5, 3.5) = 3(6.5) – (3.5)
𝑓(6.5, 3.5) = 16 maximum
𝑓(4, 1) = 3(4) – (1)
𝑓(4, 1) = 11
The vertices are named in a clockwise order in this curriculum when possible.
Explain
The vertex with the minimum value is (0, 5).
The vertex with a maximum value is (6.5, 3.5).
Plan
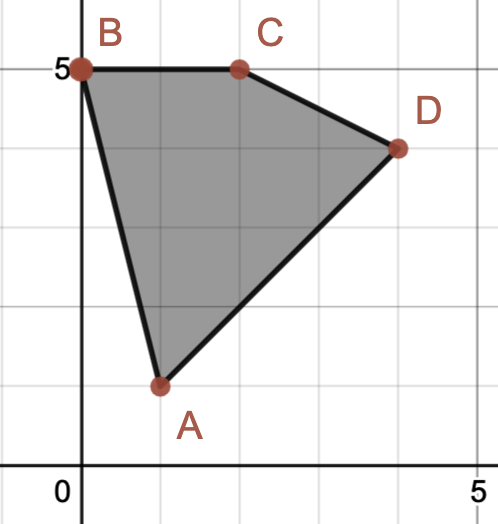
Labeling the vertices with capital letters is not required. However, it may be helpful when determining all of the equations on a given coordinate plane.
Implement
Vertices: A (1, 1) B (0, 5)
C (2, 5) D (4, 4)
The vertices can also be written directly on the coordinate plane.
Lines:
ALTERNATE
(overline{CD}\m=-frac12\b=6\yleq-frac12x+6\overline{AD}\m=1\b=0\ygeq x)
Function: 𝑓(x, y) = y – x
𝑓(1, 1) = 1 – 1
𝑓(1, 1) = 0
Minimum
𝑓(0, 5) = 5 – 0
𝑓(0, 5) = 5
Maximum
𝑓(2, 5) = 5 – 2
𝑓(2, 5) = 3
𝑓(4, 4) = 4 – 4
𝑓(4, 4) = 0
Minimum
Explain
This problem has two minimums at (1, 1) and (4, 4), and a maximum at (0, 5).
Complete the Checkpoint in your printout.
Follow the directions to complete the Checkpoint, then check in with your instructor before continuing the lesson.
Q: Can you determine the minimum and maximum by only looking at the graph? Explain.
A: No, you have to use the objective function and the vertices of the graph together.
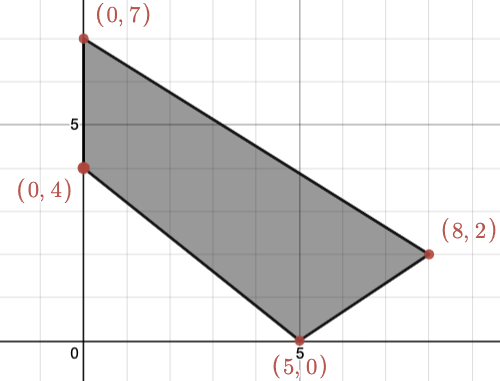
To extend this problem, your student can determine the 4 inequalities that form the shaded region, then check using technology.
x ≥ 0
y ≤ −58x
y ≥ 23x − 103
y ≥ −45x + 4
Quick test:
> and < signs (pasted into block editor)
43 = − log10(x) (entered with HTML from within block editor)
\[2\frac{1}{2}x\ +\ \sqrt{34y}\text{entered with mathQuill}\]
Long division Example
(As Custom HTML block)